Frequently Asked Questions

Supply Chain Intelligence Center Training Video
Where is the data sourced from?
The data is sourced from publicly available information including government websites and open source data sets, then collated and uploaded into the Everstream platform.
How often is the data updated?
Data related to weather and other natural hazards are updated real-time. Data extracted directly from public sources are updated daily. Other data, like website links, change less frequently and are updated as necessary.
What data is available?
We’ve gathered data we believe is most important for the supply chain. The system will continually be updated as new datasets become available. The initial release includes:
Closures:
- Shelter-in-place orders
- Government office closures
Programs:
- Access / re-entry information for businesses returning after disasters
- Business Emergency Operations Center or Private Sector Office
Waivers:
- Increased size & weight limits
- Hours of service waiver
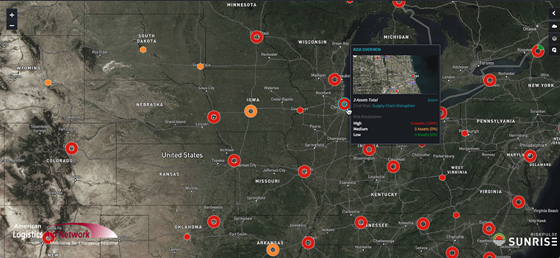
What do the dots and circles on the map mean?
These represent assets and clusters of assets. Assets are locations which have significance to the supply chain; we have configured major city centers, ports, airports, border crossings, fuel infrastructure, and interstate markers. If you click on a cluster, it will zoom in and show you more detail.
Can I add my own assets?
To add your own assets, such as distribution centers, clients, suppliers, etc. you’ll need to upgrade to a full license. Please visit https://www.everstream.ai/request-demo/ to request more information. By upgrading, you may also view your own multi-modal lanes and shipments, and monitor the risk to them.
What are the weather threats I can monitor?
The Supply Chain Intelligence Center allows you to monitor severe weather events. Using the ‘Overlays’ tab on the right-side menu, you can layer on various weather parameters to monitor for impacts.
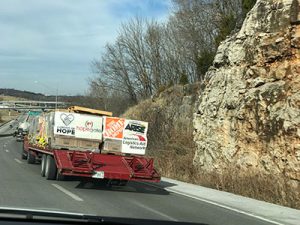
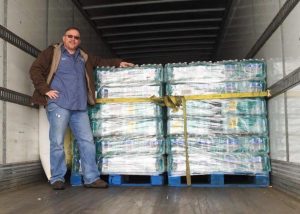
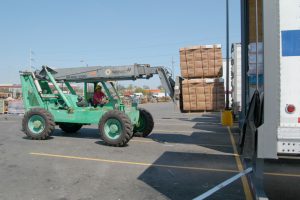
Who is American Logistics Aid Network?
Founded in 2005 in the wake of Hurricane Katrina, American Logistics Aid Network, or ALAN, is a philanthropic, industry-wide organization that provides free logistics assistance to disaster relief organizations before, during and after catastrophic events. It does this by bringing the expertise and resources of the logistics industry together with compassionate organizations so that help can arrive sooner, and each relief dollar can be maximized. Over the years it has coordinated humanitarian supply chain services for natural disasters including hurricanes, wildfires, tornadoes and floods. You can find information on our current disaster response activities on our Disaster Micro-Site at https://www.alanaid.org/operations
Who is Everstream Analytics?
Everstream Analytics sets the global supply chain standard. Through the application of artificial intelligence and predictive analytics to its vast proprietary dataset, Everstream delivers the predictive insights and risk analytics businesses need for a smarter, more autonomous and sustainable supply chain. Everstream’s proven solution integrates with procurement, logistics and business continuity platforms generating the complete information, sharper analysis, and accurate predictions required to turn the supply chain into a business asset. To learn more, visit https://www.everstream.ai/.
How can I help support these efforts?
We are seeking partners to ensure this platform continues assisting organizations in blue skies and grey. Please donate today! https://www.alanaid.org/donate.